
Benchmarking the new real-time warehouse
TL;DR
- What it is: a new SQL warehouse type from Databricks, running on a new engine called Reyden, built for fast and highly concurrent SELECTs straight on your Delta/Iceberg tables. No copies and no extra serving layer.
- What I tested: a JMeter benchmark comparing RT SMALL against Serverless SMALL, same size, same data, one clickstream table plus 3 dimension tables, across 7 query patterns and 2 table layouts. SMALL is the smallest RT warehouse you can get right now so no XS or 2XS options (yet).
- Speed: RT wins every single query, anywhere from 1.5x to almost 6x faster, and it roughly doubles the throughput at the same warehouse size. So faster for sure but I did not see anything close to the marketed sub 100ms performance.
- Table design matters: Auto Cluster and Partitioned + ZORDER pull performance in opposite directions depending on whether you’re doing point lookups or range aggregations, and that happens on both warehouse types.
- Cost: assume RT costs the same per hour as Serverless, no promo pricing, and it comes down to something simple: cost per query. This would make //RT the default choice for serving as it simply gets more done with the same compute power.
- Bottom line: if you’re running a separate real-time layer purely for latency SLAs, it’s worth benchmarking RT against your own data before you renew that setup.
So what is Lakehouse//RT?
Databricks really aims to be the Unified Data Platform, from streaming, batch, ML, governance to Metric Views (I wrote about those here This link opens in a new tab). Lakehouse//RT applies that same story to the one spot Databricks didn’t really have a strong answer for yet: sub-second, high-concurrency serving. It was announced at Data + AI Summit 2026, with full details in the launch blog post This link opens in a new tab. The engine behind it, Reyden, is built from scratch rather than being an evolution of Photon. Photon is great at big, long analytical scans, while Reyden is built for the opposite: lots of ‘small’, concurrent, interactive queries with millisecond-level SLAs. You can watch Reynold Xin introduce it in the DAIS keynote, This link opens in a new tab and the docs walk through setup This link opens in a new tab In practice it just another warehouse type working on data already stored (no additional movement needed), which is about as low friction as it sounds. For my benchmark I did not have to change any of the queries which is great.
The marketing pitch is bold: response times as low as 10ms on smaller datasets, sub-100ms on bigger ones, and, according to Databricks’ preview customers, up to 16x better performance than other real-time serving layers (whatever that means…). All running natively on Unity Catalog-governed Delta/Iceberg tables.
If the speed, concurrency, and cost actually hold up at scale, this opens a few doors:
- BI reports that query live data instead of a pre-aggregated extract, because the warehouse can actually keep up with dashboard refreshes and dozens of concurrent viewers. No more timing issues loading BI models and potentially save some money on BI licences.
- Operational dashboards for teams who need to see what’s happening right now, not what happened after the last batch job, especially once you pair RT with Zerobus Ingest, Databricks’ push-based ingestion API that lands event data into Delta tables in as little as five seconds, no message bus required. Fast ingestion in, fast concurrent reads out, that’s basically the whole stack for an operational dashboard, built entirely on lakehouse tables. If you’re curious whether skipping the message bus actually holds up on cost, SunnyData ran a Zerobus vs. Kafka comparison This link opens in a new tab worth reading.
All the numbers so far are vendor-provided, and “up to 16x” would be a stunning improvement. So I stopped reading blog posts and just benchmarked it myself.
Benchmark setup
I used JMeter to compare RT SMALL against regular Serverless SMALL, same size, same data, running in Azure West Europe region. The dataset was a real clickstream fact table containing 250M records, small by Databricks standards but realistic for this kind of workload, joined against 3 dimension tables: user, device type, and page. It’s a pretty typical star shape for the analytics serving RT is being pitched for.
To see how much of RT’s benefit depends on table layout, I tested two versions of the same fact table:
- Auto Cluster enabled (Databricks manages clustering automatically) which was optimized after some initial benchmark runs.
- Partitioned by year + month, ZORDER on session_id and event_timestamp which are filtered on in some of the queries
I ran the same 7 queries requiring somewhat different access patterns against both layouts:
- Single event lookup by ID.
- Multi-record lookup, all events belonging to one session.
- Same session lookup, but with 3 LEFT JOINs against the dimension tables.
- Single-session aggregation, duration, unique pages, and so on.
- Sessions aggregation over a random 3-month window.
- Landing-page aggregation via a Metric View, over a random 7-day window
- Hash-mod based session aggregation (hash(session_id)%10000 = 0 à ~500 sessions)
Every run pulled its event IDs and date ranges at random from a 10K-record sample, so I wasn’t hitting the query cache.
Before collecting anything, I warmed up each warehouse by running the full query suite five times and throwing those results away. Effectively this made sure that most of the data was loaded from cloud storage onto warehouse SSD and avoided benchmarking the cold-start. Then came the real test: 5 threads, each running every query 25 times, for 875 queries per scenario across 4 scenarios in total. Everything ran through the SQL Statement Execution API, and JMeter captured round-trip-time, success/failure, and payload size for every single call.
Good to note that all queries executed on RT without any changes.
Results
Let’s start with the headline number: average latency per query, across all four scenarios.
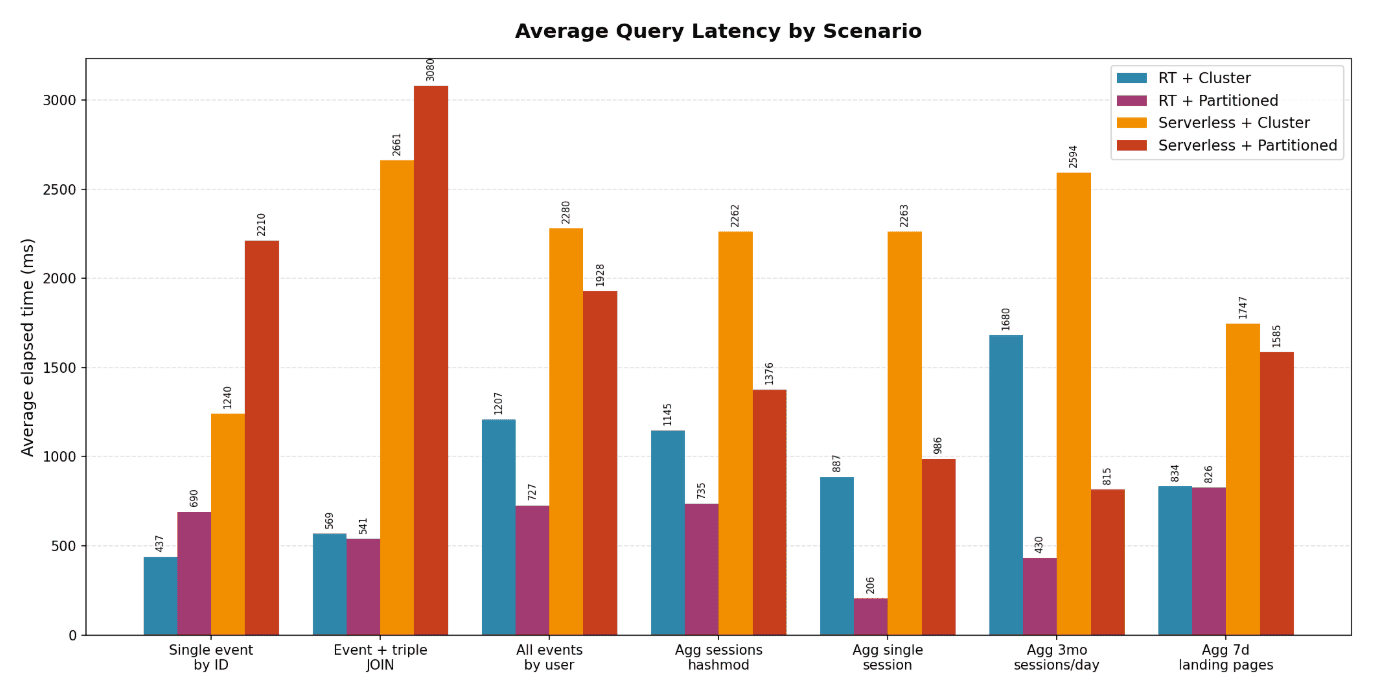
RT beats regular Serverless on every single query, in both table layouts. The gap is smallest on the big 3-month aggregation, where RT is “only” 1.5–1.9x faster, and largest on the join-heavy lookup, where it’s 4.7–5.7x faster. On average RT showed roughly double the queries per second. For this query mix the partitioned + zorder optimization proved to be the best with all queries showing sub second execution times on average.
Things get more interesting once you split the 7 queries into lookups vs. aggregations and compare layouts within each warehouse type:
- On Auto Cluster, aggregations are consistently the slower half of the workload on both warehouses. Clustering does more for point lookups than it does for anything scanning a date range.
- Flip to Partitioned + ZORDER, and the picture reverses completely. Aggregations get dramatically faster, the 3-month session aggregation drops 74% on RT and 69% on Serverless, while the plain single-record lookup gets noticeably slower, 58% worse on RT and 78% worse on Serverless. Partition pruning and ZORDER are doing exactly what they’re supposed to for range scans, but that comes with overhead a simple “give me this one row” query doesn’t need.
This is no real surprise but good to know that table layout still matters (a lot) with RT.
The timeline view below displays all 875 query execution times for the various scenario’s and shows total benchmark duration and execution variance.
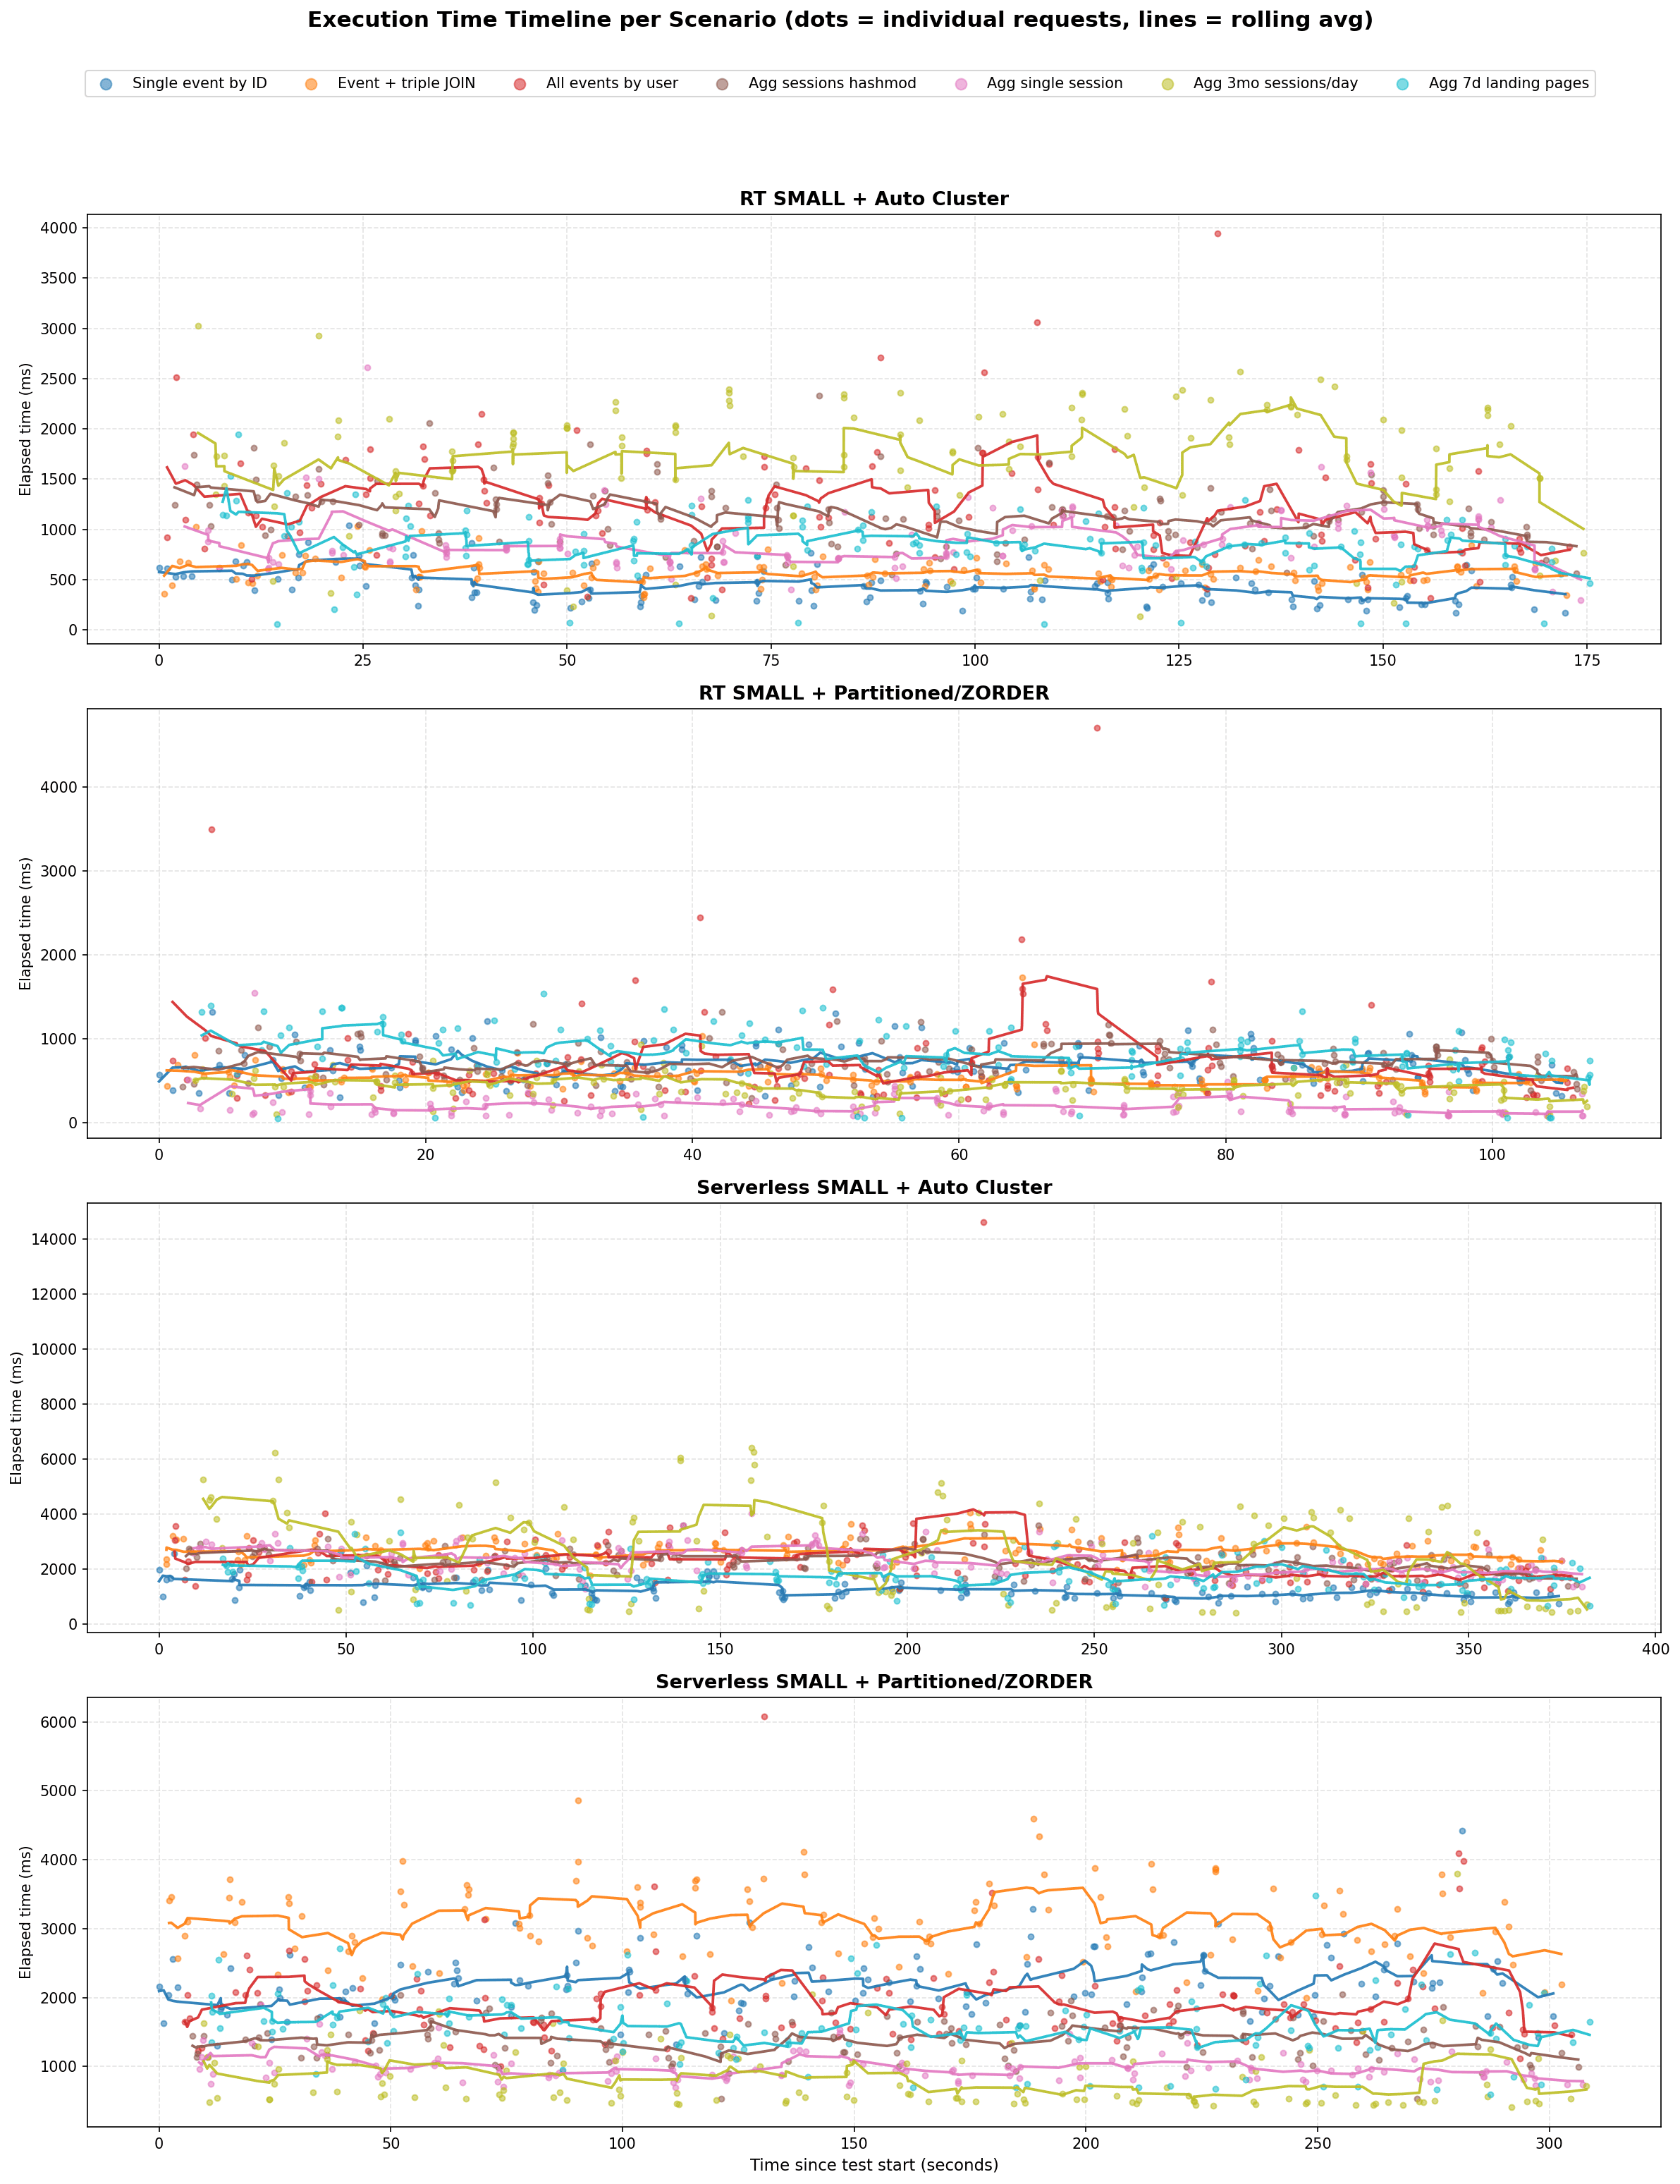
Overall the RT warehouse using partitioned and ordered data had a stable throughput of 8.1 queries per second, followed by RT on clustered data with 5 queries per second. This means that a report with 8 visualisations using such a query load would refresh within 1 – 2 seconds on RT.
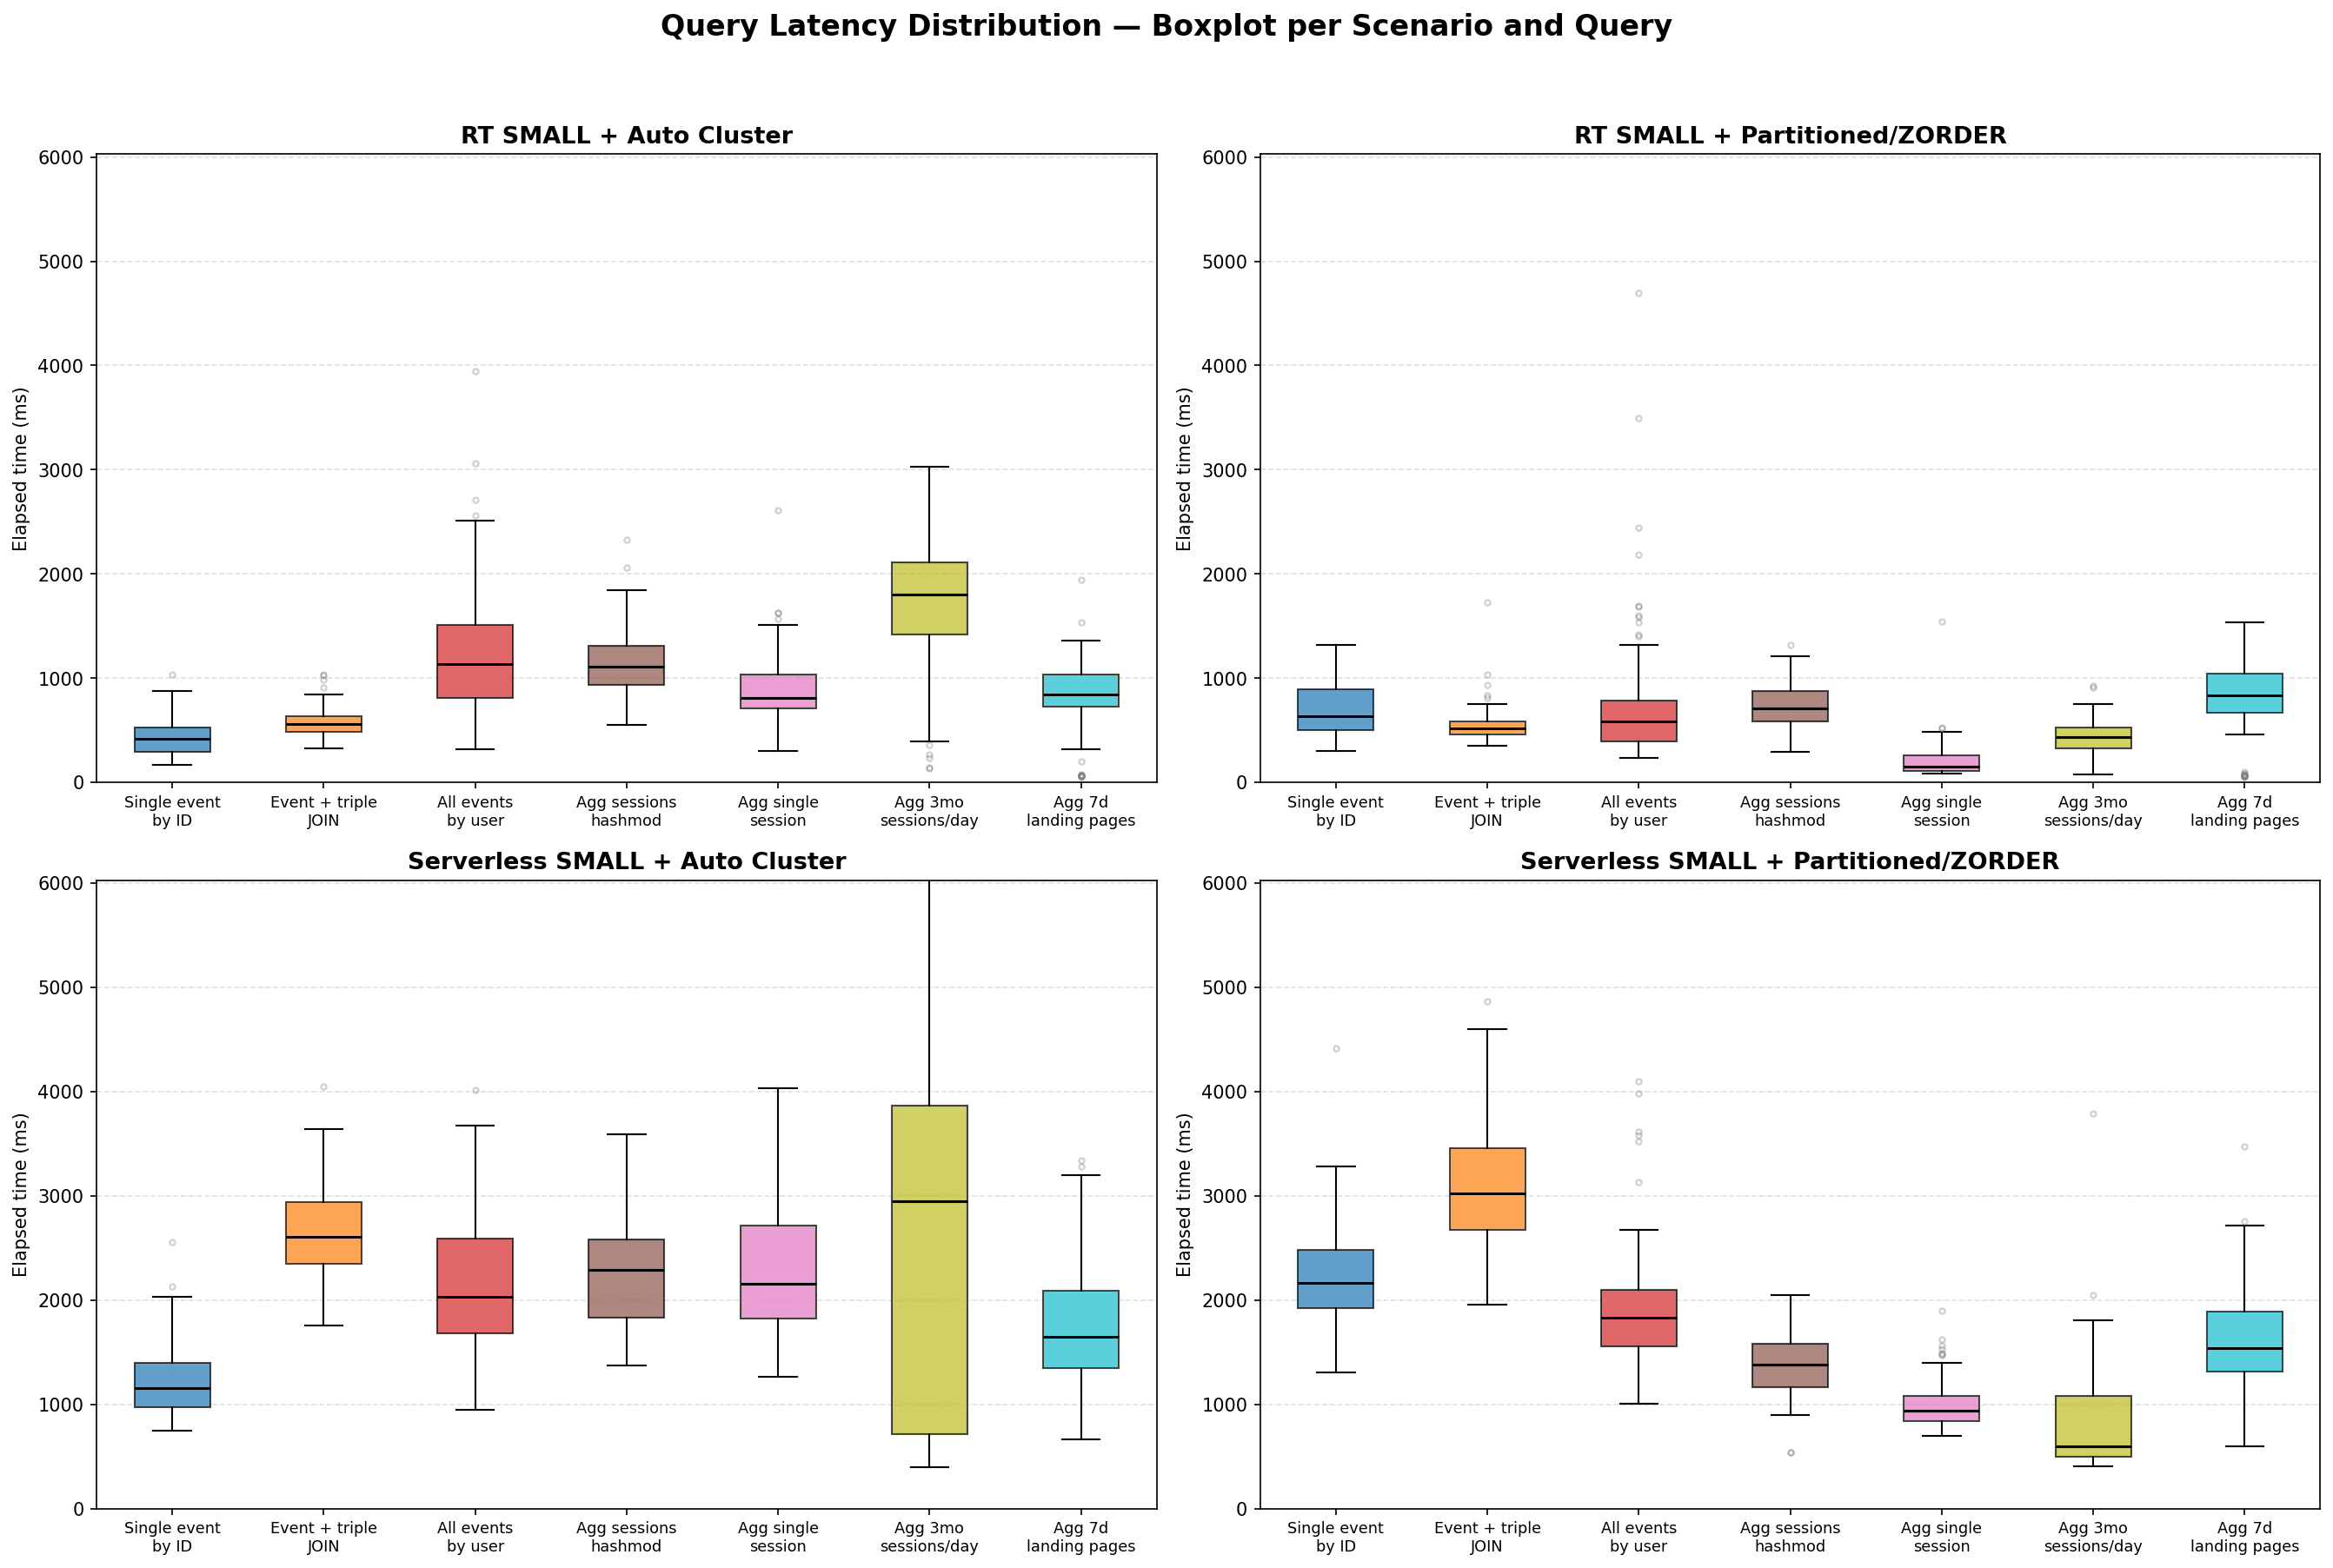
The latency distributions show that RT is a lot more stable/predictable than the regular Serverless warehouse with the partitioned/zorder scenario showing sub second average execution.
Conclusion
A few takeaways from this whole exercise:
RT has proven faster than regular Warehouse but did not get close to sub 100ms. In this benchmark RT was consistently faster on every query by a healthy margin. For workloads that need lots of small, concurrent, low-latency SELECTs, think live dashboards, operational insights, or ad-hoc lookups, this is a real improvement. That said, I tested SMALL against SMALL, so whether the gap holds up at bigger (or hopefully in the future also smaller) is exactly what I’d want to test before betting a production architecture on it.
One honest caveat: throughput improved noticeably, but execution times where nowhere near the sub-100ms numbers from the marketing material. That’s probably down to the workload mix I benchmarked, since a blend of point lookups and aggregations is genuinely hard to optimize for all at once. If I optimized for a single workload type instead like aggregations on date and popular dimensions I’d expect the numbers to improve even further.
Cost-wise, assuming RT costs the same as normal Serverless it comes down to cost per query. RT wins clearly there too, getting more done per euro and per core. That’s a solid argument for making RT your default choice for serving lakehouse data, not just a nice-to-have for latency-sensitive edge cases.
Next up, I want to test the combination of Zerobus with an RT Warehouse to see if this setup is feasible for more operational monitoring use-cases. Stay tuned.