
How to demonstrate what IT delivers
This article is part 4 of a series on IT Financial Management (ITFM): from transparency in IT costs (part 1), through showback and chargeback (part 2), modern budgeting and forecasting (part 3), managing value through benchmarks and KPIs (part 4), freeing up budget for innovation (part 5), and building a mature ITFM organization as a source of competitive advantage (part 6).
“We from IT are primarily seen as a cost center in the business, not as a strategic enabler.”
“The board asks about what IT contributions, but the conversation revolves around cost and volume figures.”
This tension plays out in many boardrooms. IT has a cost overview in order but lacks the narrative around value. The result: the CIO explains the numbers but is rarely involved in decisions about where the organization invests. In article 3, the focus was on how to gain control over budgeting and forecasting. The subsequent question is: how do you show what that budget delivers?
“Value-based management isn’t just another report; it’s a different way of looking at the same cost picture.”

The pain: numbers without a story
Many CFOs find it challenging to position IT in the boardroom as more than a cost center. Discussions often revolve around cost levels and generic benchmarks, with no clear connections to customer satisfaction (NPS), growth, or risk.
An IT cost line that decreases by three percent sounds like good news, until someone asks what that means for customer service. Without a value narrative, there is no answer. More figures will not solve that. What does help is deliberately putting cost and performance side by side.
Why managing IT for value is challenging
The effects of IT are often indirect: customer satisfaction, lead time, fewer errors, compliance levels. They rarely translate directly into a financial KPI. At the same time, the relevant data sits in silos: finance looks at opex and capex, IT focuses on availability and incidents, while the business concerns itself with customer satisfaction (NPS), conversion rates, and lead times.
Benchmarks are requested but often misinterpreted. Low IT spend as a percentage of revenue looks favorable, until it turns out the organization is lagging in digitalization. Low cost per user looks efficient, until the workplace becomes outdated, negatively affecting productivity and employee satisfaction. Organizations that do not use benchmarks at all miss out on a mirror. Without an external comparison, it is difficult to recognize inefficiency or underinvestment.
Managing value becomes possible only when three things come together: cost transparency by service, application, and domain (article 1), visibility of consumption by department or product line (article 2), and a budgeting and forecasting process that adapts to reality (article 3). Without that foundation, KPIs and benchmarks remain isolated figures, and the conversation about value becomes primarily a matter of persuasion.
Featured Infographic
ITFM in 2 minuten
Missen organisaties inzicht in IT-kosten? Het TBM Framework van Eraneos brengt structuur. Download onze infographic en ontdek hoe IT groeit.
Read more about this infographic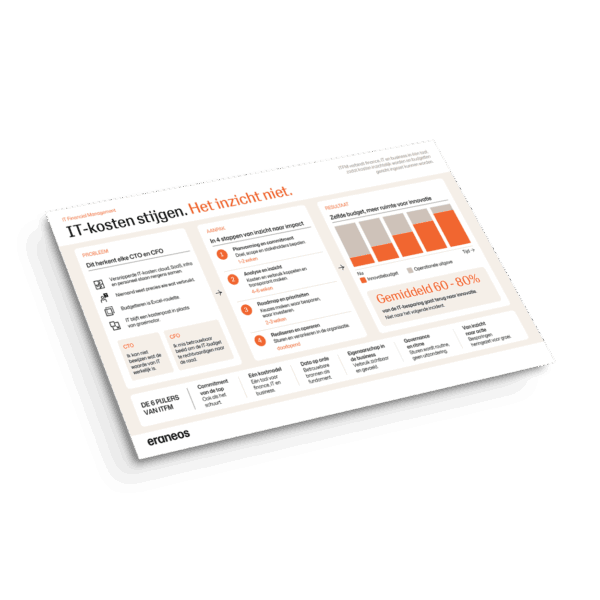
What does "managing value" mean in an ITFM context?
Managing IT for value is not an additional report. It is a different way of looking at the same cost picture
Link cost to objectives. Instead of saying “we spend X on applications,” say “we invest X in customer service, Y in risk management, Z in innovation.” This way, you identify which IT services tangibly contribute to better performance, and which show little effect.
Combine financial and non-financiel KPIs. Costs per user or per service only becomes meaningful when combined with availability, lead time, NPS, or incident levels. A deviation in costs without a corresponding performance improvement is often the first sign of inefficiency.
Use benchmarks as a mirror, not a standard. The question is not “do we have the lowest prices in the market?” but “where do we differ, and is that a deliberate choice or a sign of inefficiency?” Benchmarks are not a tool for cutting a generic percentage from the IT budget. They help you identify where you are genuinely out of line.
Relevant KPIs and benchmarks
This is not about having a long list, but rather a small number of metrics that trigger the right conversation. On the cost side: IT spend as a percentage of revenue, costs per user or service, and the split of spending across run, grow, and transform. On the value side: availability, lead time, time-to-market, and incident levels.
These numbers usually exist already but are rarely explicitly compared. The run/grow/transform framework is used here mainly to structure the conversation. In article 5, we will show how to shift budget between these categories.
From cost insight to a concrete value profile
Take one or two value streams or products: a digital customer channel, an order process, or a risk domain, and create an initial value profile for each. A value profile captures the strategic and operational value that an IT organization, application or technology delivers to the business. It brings three elements together: the IT costs from your cost model, the relevant business KPIs, and one or two benchmarks.
Example: A digital customer channel
Suppose you take a closer look at your digital customer channel. It costs amount to €12 per transaction, compared with a benchmark of €10. Anyone looking at costs alone sees a problem.
Add performance to the picture and a different story emerges. The average lead time is two seconds, compared with three seconds in the benchmark. Customer satisfaction is also higher: an NPS of 85 against 75.
The question is then no longer “Why are our costs higher?” but “What value do customers and the organization get in return for those higher costs?” If speed and customer satisfaction are central to the customer strategy, a higher cost level may well be a deliberate choice.
That does not mean optimizing is unnecessary. The organization can still investigate which components of the channel drive costs and whether those costs can be reduced without affecting speed or customer satisfaction. But a generic cut is not self-evident.
That is the value of such a profile: costs, performance, and a benchmark come together in a single conversation. The CIO can explain which IT investments contribute to service delivery. The CFO can assess whether the costs are proportionate to that contribution. And the business can decide which aspects of performance really matter.
Bring these value profiles into portfolio and budget discussions. The conversation then shifts from generic cuts to the IT budget toward targeted choices per value stream. At Eraneos, we see that this shift, from a single IT line item to a handful of value profiles, is the moment when IT starts to take on a different position in the boardroom.
What changes when you manage for value?
When costs, performance, and benchmarks are visible for each value stream, the conversation changes. It is no longer about one IT line that should go up or down, but about concrete choices. For the CIO, this is the difference between defending the IT bill and having a say in investment decisions. In the boardroom, the CIO can show how costs and value relate for each domain. In domain X, our costs are high and value is low, so we need to act. In domain Y, we invest relatively heavily, but that supports our growth strategy. For the CFO and the business, the discussion shifts from “IT is expensive” to “What does this support deliver, and are the costs proportionate?”
This requires an investment in data, definitions, and dialogue. But once the first value profile is in place, the role of IT in conversation evolves: less as an anonymous cost center, more as a partner in discussions about value and priorities.
What does this mean for you?
Ask yourself three questions:
- Can you show today, for your most important value streams, how much IT cost lands there, which business KPIs relate to it, and how you compare with similar organizations?
- Do you have insight into the split of IT spend across run, grow, and transform, and can you explain why that distribution aligns with your strategy?
- When was the last time you discussed IT costs in a board or executive meeting, explicitly alongside performance and customer impact?
If the answers are mostly “we should look into that” or “I can’t remember,” then you are likely still managing cost rather than value. That is not a criticism. It is a signal that the IT’s contribution is not yet systematically visible in terms that resonate with the board.
Start small
As previously mentioned: take one value or product stream where you already have cost and consumption data. Bring the three elements of a value profile together: the IT costs from your cost model, a few relevant business KPIs, and one external benchmark. Discuss that first value profile at the next portfolio or budget meeting, with the CIO, CFO, and the accountable business leader at the table. Use that conversation to assess whether the combination of costs, performance, and benchmarks triggers the right discussion, and refine the profile as needed. Only then expand the approach to other value streams or domains.
Next in this series
In the next article, we will address how to use these insights to actually shift budget from run to grow and transform. How do you create room for innovation without additional budget, and how do you make that shift structural rather than a one-off exercise?


