If you’ve been working with Databricks lately, you’ve probably heard about Metric Views, the centralized way to define and manage core business metrics. After spending some quality time with them in a high-volume e-commerce environment, we’ve got some thoughts to share. Is it a game-changer? Mostly. Is it perfect? Not quite. Let’s dive into the “what, why, and the ‘ugh’” of Databricks Metric Views.
TL;DR
- Metric Views allow you to define business logic (measures and dimensions) once in Unity Catalog and reuse them everywhere
- The big win: it makes downstream data marts way simpler and provides context for AI tools like Databricks Genie. Consumers who support it can query it directly which could eliminate the need to build specific data marts altogether.
- The result: much faster delivery and way fewer “why does this dashboard show a different revenue number?” conversations.
What are Metric Views
At its core, a Metric View is Databricks’ native answer to the “Semantic Layer” problem – very similar in spirit to the dbt Semantic Layer, but built directly into the Lakehouse. When you query a Metric View, you aren’t just hitting a static table. Under the hood, Databricks rewrites your SQL to ensure the results are mathematically accurate based on the relationships and logic you defined in your YAML. It handles the complex joins and aggregations dynamically so you don’t have to worry about fan-out issues or chasm traps.
The absolute number one reason to use Metric Views is logic reuse. As data/analytics engineers we have all seen the issue of slightly different definitions/calculations in different places of the data platform. It is hard to properly define and maintain definitions across different teams, pipelines and data products. Metric Views provide a way to stop repeating ourselves (DRY) when it comes to these definitions and measures. Additionally it provides rich context like comments, synonyms and formatting which are great to improve understanding not only for users but also AI. It’s really the “cherry on top” of a solid, reusable logic layer.
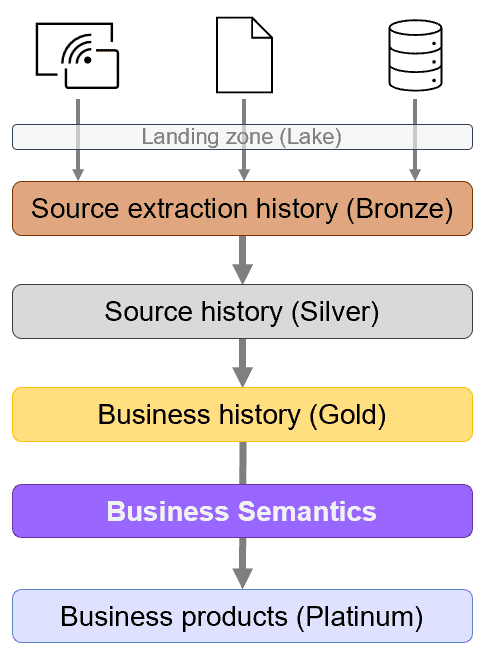
From an architectural perspective these Metric Views would make up a Business Semantics layer between the Business History (Gold) and Business Products (Platinum data marts). I’m actually planning another article on an alternative layer naming convention as I find the bronze-silver-gold naming really limiting and non descriptive. The current situation is a good example and I have seen layers called Tin and Diamond to stick with the metal theme while they do not mean anything in the context of data architecture. But lets save that for another article and continue the Metric View journey.
Metric View optimization
By default Metric Views really behave like views and simply rewrite queries into pure SQL which can get slow for complex queries on big datasets. To solve this issue Databricks makes it possible to create multiple materializations for a single metric view (for example, one for daily aggregations and another per customer group).
When a user queries the view, the Databricks query optimizer looks at the execution plan and decides which materialization is the most efficient one to use. If no materialization fits, it just computes the result on the fly. It gives you the flexibility of a view with the raw power of a physical table when you need it.
My E-commerce experience
Within one of my projects in the ecommerce domain we had challenges correctly reusing business logic so we decided to test Metric Views. For now we ended up using just two metric views as basis for over 75% of all business questions / datasets.
- The orders view: a classic combination of order line facts joined with sales channels, customer, and product dimensions.
- The web session view: clickstream events joined with page and visitor dimensions.
Defining the logic
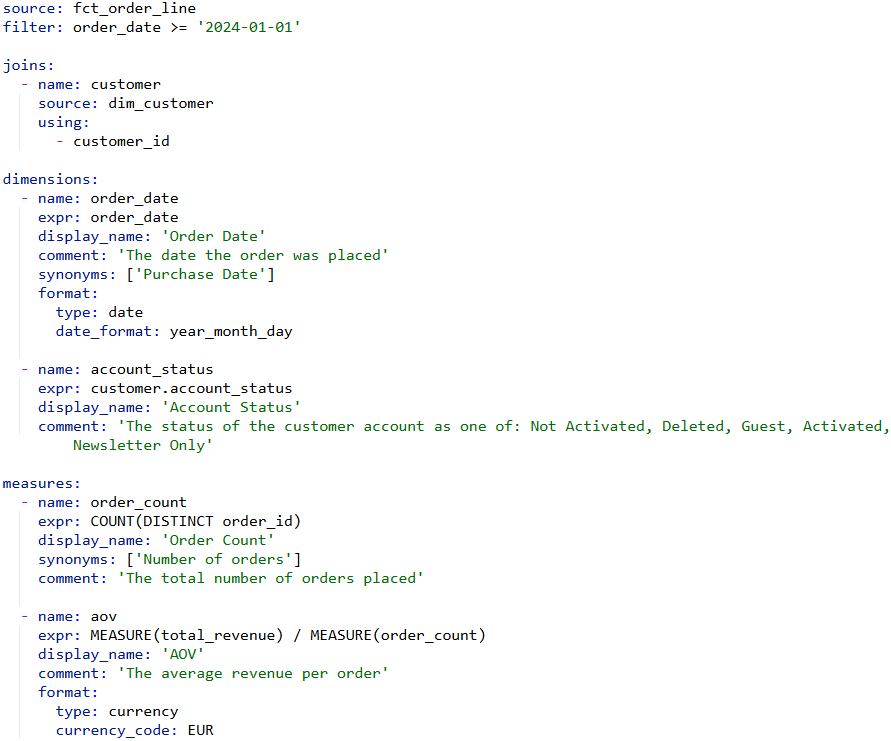
Starting from the fact tables, I defined the joins and pulled in the most relevant dimensions. This is where the magic happens—consumers can now slice, dice, and aggregate without knowing how the underlying tables are joined. An example definition including a join, some dimensions and measures is shown below.
A Definition of a data mart, would become something like this (using the Pipe SQL syntax, see this article for an introduction into this).
CREATE OR REPLACE [TABLE | VIEW] order_mart AS
FROM order_metrics
|> AGGREGATE
MEASURE(order_count) AS number_of_orders,
MEASURE(aov) AS average_order_value,
GROUP BY order_date, account_status
I started migrating our existing data marts to use these views instead of aggregating the dimensional warehouse. Because the heavy lifting (the calculations) is now inside the Metric View, the code for the data marts became significantly shorter and easier to validate. No more copy-pasting the same SUM FILTER WHEN logic across multiple jobs just include MEASURE(…) and done.
AI that actually works
The real “aha!” moment came when I created a Databricks Genie space using these Metric Views. In the past it struggled using normal tables with minimal comments because the AI had to “guess” which columns to aggregate and how to calculate the things I asked it for. Because I’ve provided context, synonyms, and pre-defined measures, Genie becomes a lot smarter. It can handle queries that used to take me significant time to write and validate manually:
- Year-over-Year Comparisons: “Show a timeline of this year’s revenue compared to last year by week.” It even handled follow-ups to split the results by country or order category effortlessly. Not so hard for an engineer to do but challenging for business users to say the least.
- Outage Detection: I asked it to find moments in 2025 where one of the web shops might have been down. There is no real outage information present in the data so instead it looked for times that should have had sessions/orders but didn’t. It correctly identified moments where there were issues.
- Deep-Dive Analysis: I asked for insights on discounts over the last two years. It identified specific dates where discount policies changed and—get this—when I asked it to estimate 2025 revenue if we hadn’t changed the policy, it applied historical percentages to 2025 data to give a reasonable “what-if” answer.
I realise these are not the hardest of questions but before Genie really struggled with these while now it is able to pull these off, sometimes with an additional hint or correction, but mostly on its own.
My conclusion
I’m very positive about Metric Views and really see the value it brings by making logic reusable. I get why the specific MEASURE syntax is required (to ensure you know you’re getting an aggregated result), but it feels like an unnecessary hurdle for most users as they have to know the dimensions and measures defined. Why not allow for an implicit aggregation mode to simply run SELECT country, revenue FROM orders_metric_view instead of ‘SELECT country, MEASURE(revenue) FROM orders_metric_view GROUP BY country’ (for one measure it is ok but if you include hundreds it becomes very repetitive).
Also, I’m crossing my fingers that the industry eventually allows these semantic definitions to be shared between different technologies such as BI tools so we don’t have to rebuild the logic again across the technology stack used.
Metric Views require more effort upfront to maintain, but the downstream payoff – simpler code, consistent numbers, and AI that actually understands your data – is massive.